Monitor listing use
This topic explains how to monitor the performance of your listing in terms of usage and best practices.
Which metrics are tracked?
Depending on whether you offer your listing privately or on the Snowflake Marketplace, you see different usage analytics. To see who is using your listings, you can use Provider Studio or the database views provided by Snowflake.
Snowflake tracks many metrics for listings, including the following:
Daily telemetry usage for your listing, such as the daily consumer query history.
Events when consumers get or request your listing.
Events when consumers view or click your listing detail page on the Snowflake Marketplace.
Use of your listing, such as number of jobs run on the data product in your listing.
Access details for your listing, such as viewing the tables in your listing.
The company name and account name of consumers accessing your listing.
Information consumers submit when requesting unlimited access to a limited trial listing.
And more.
See DATA_SHARING_USAGE and ORGANIZATION_USAGE for more details about viewing this information in SQL.
For a full list of metrics tracked for listings, and details for viewing this data using SQL, see DATA_SHARING_USAGE and ORGANIZATION_USAGE.
For paid listings, you can see additional data on a per-listing basis or for all paid listings in your organization:
Earnings history for your listings.
Charges accumulated by type of charge.
Number of queries included in the charge to a consumer.
Number of consumers trialing your listing.
Number of purchases of your listing.
And more.
See Monetization usage views for more details about viewing this information in SQL.
Monitor consumer usage metrics in Provider Studio
To help you manage the performance and usage of your listings, Provider Studio provides overview analytics on the Home tab and aggregated and detailed analytics on the Analytics tab.
Note
Providers receive usage data and other details as described in Monitor listing use. Consumers accessing a data product containing a Snowflake Native App will receive consumer-related monitoring data only if the app emits events specifically for the consumer.
Prerequisites for viewing usage data in Provider Studio
Before you can view usage data, make sure that you meet the prerequisites.
To view Provider Studio and the data on the Home and Analytics tabs, you must use the ACCOUNTADMIN role or a custom role granted the CREATE LISTING privilege and IMPORTED PRIVILEGES on the SNOWFLAKE database. See Enabling The SNOWFLAKE Database Usage For Other Roles.
You must select a warehouse that Snowflake can use to bill your account for the queries that generate these usage analytics. You are billed at the normal rate for these queries. See Understanding Compute Cost.
View usage data in Provider Studio
To view usage data in Provider Studio, do the following:
Sign in to Snowsight.
In the navigation menu, select Data Products » Provider Studio.
Select a warehouse. In the upper-right corner of the page, click Select Warehouse.
Queries to show analytics data on the Home tab and Analytics tab run successfully and display results.
You can see trends from the last 28 days on the Home tab, including the following:
The number of queries executed by consumers against your data products, including how those numbers are trending compared to the previous 28 day period.
The number of unique consumers that have queried your listings, including how those numbers are trending compared to the previous 28 day period.
The name of your most-queried listing.
The consumer who has run the most queries against your listings.
On the Analytics tab, you can see additional metrics, both aggregated across all your listings or a detailed view for a specific listing.
View overview analytics for your listings
You can see the following overview metrics for your listings:
The reach of your listings on the Snowflake Marketplace, such as views of all of your listings, and a list of the most-viewed listings.
Engagement with your listings, based on the number of queries executed. You can see the following engagement overview metrics:
The number of queries executed across all your listings.
Your listings ordered by usage, determined by number of queries executed.
The number of consumer accounts actively using your listings per day.
A ranking of the most active consumers, based on query execution.
A list of the regions in which consumers execute the most queries.
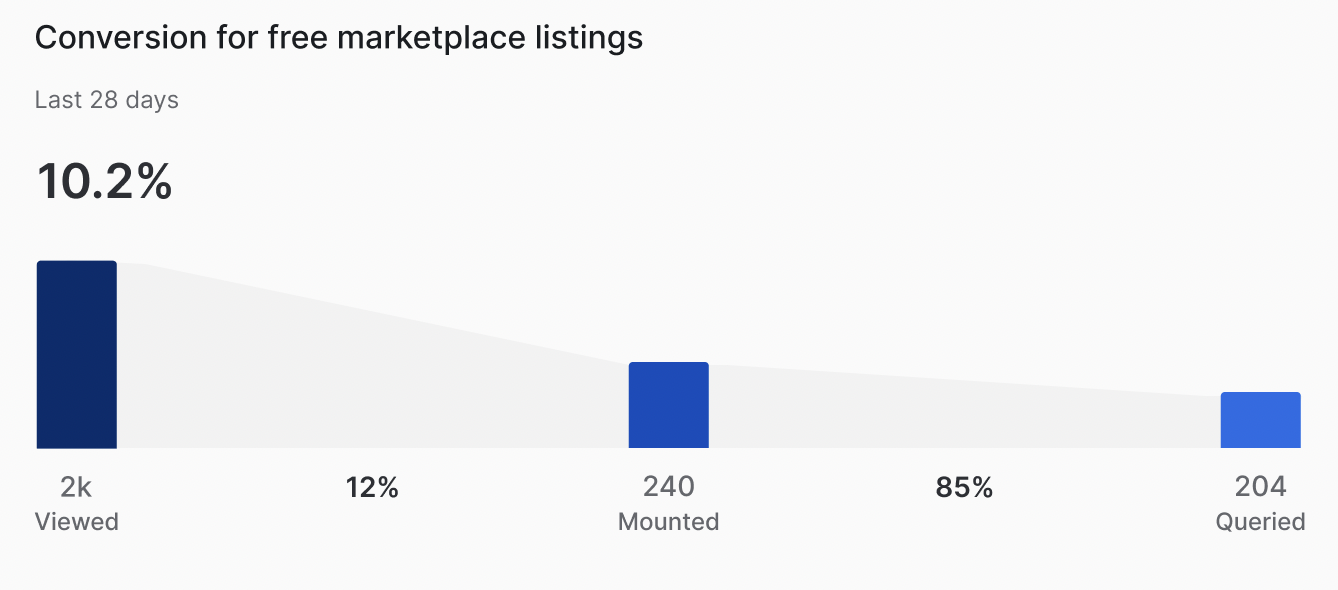
For your free listings on the Snowflake Marketplace, you can see consumer conversion from viewing, mounting the share, and querying your listings. You can only see consumer conversion over the last 28 days.
View detailed metrics for your listings
On the Analytics tab, if you select More for a specific metric or select Detailed Metrics, you can see the following analytics:
Metric |
Details |
|---|---|
Active consumers |
The number of unique consumers that have queried your data products. |
Consumer requests |
The number of consumers that have requested replication of your free listings to their region or requested unlimited access to limited trial listings. |
Listings installed |
The number of listings that consumers have installed in their accounts. |
Listing views |
The number of times that your listings offered on the Snowflake Marketplace have been viewed. |
Queries executed |
The number of queries executed against your listings. |
Using the detailed view, you can filter the data by time, exchange, consumer, listing name, or region.
View consumer details for your listings
You can see consumer details, including the company name and Snowflake account name for the consumer, in several places:
In the Usage Trends on the Home tab that lists the most active consumer.
On the Overview tab in the Most active consumers tile.
In the detailed metrics for Listings Installed, Consumer Requests, and Queries Executed when viewing a specific listing.
To see which consumers are installing and using your listings, do the following:
Sign in to Snowsight.
In the navigation menu, select Data Products » Provider Studio.
If you do not have a default warehouse set, select a warehouse. In the upper-right corner of the page, choose Select Warehouse.
Select Analytics » Detailed Metrics.
Select the Queries Executed drop-down and select Listings Installed.
Review the table of listings and select a specific listing that you want to see details for.
In the table of All consumers for the selected time period, review the company name, account name, first name, last name, email address, and region of the consumer that installed the selected listing. If the company name is not available for a consumer, you instead see the Snowflake organization and account names.
To see other details about consumers using your listings, review the Most active consumers tile on the Overview tab. It shows a list of consumer company names ordered by how many queries they executed against your data product in the selected time frame. Select a consumer to see detailed metrics such as the dates of usage and Snowflake region of the consumer account.
View usage data by using SQL
The overview metrics on the Analytics tab are derived from the metrics in the DATA_SHARING_USAGE schema. Some metrics, including most active consumers, conversion rate, most viewed listings, and most used listings, are derived from the metrics and might not exactly match what you can see in the schema.
The detailed metrics on the Analytics tab are obtained by querying the views in the Data Sharing Usage schema.
If you want, you can query the views directly. See Data Sharing Usage.
Because the views are part of the SNOWFLAKE database, only account administrators (users with the ACCOUNTADMIN role) can perform queries on the data sharing usage for the listings published from that account. Privileges can be granted to other roles in your account to allow other users access. For more details, see Enabling Account Usage for Other Roles.
Note
The DATA_SHARING_USAGE schema is not updated immediately. There can be up to two days of latency between an event occurring and updates to the DATA_SHARING_USAGE schema.
Improve listing performance in the Snowflake Marketplace
If you publish your listing on the Snowflake Marketplace and want to improve the listing performance with consumers, review the Snowflake Marketplace Provider Best Practices. For a video on how to use Provider Studio to review the performance of your listings, see Provider Studio Analytics - Understanding Listing Performance.